
NillsF blog

  • Home
  • About

Tag: matplotlib

Adding x-axis to matplotlib plots in Jupyter notebooks

August 7, 2020August 7, 2020 nillsf Leave a comment

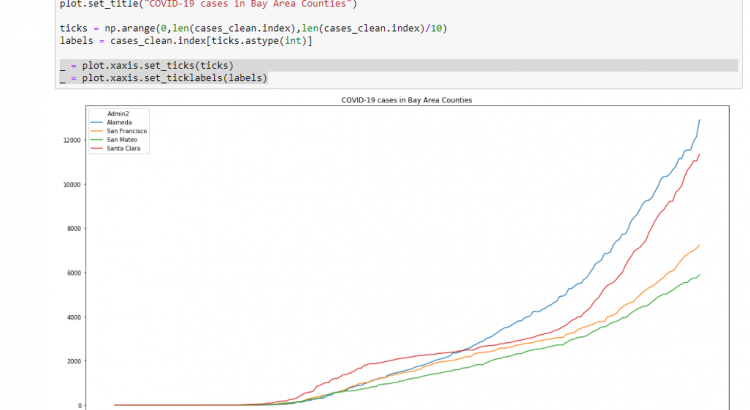
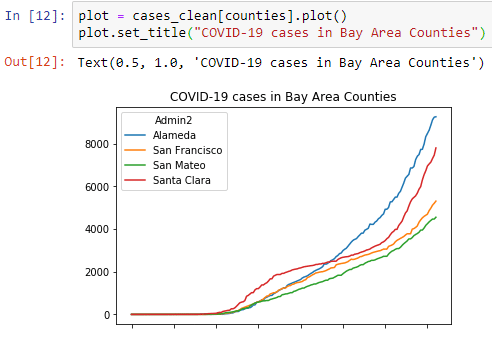
I’ve blogged before about how I’m doing some of my own data analysis on the COVID-19 numbers. One thing that I didn’t like about my graphs was that they didn’t contain an x-axis, which made them a little bit harder to read. In this (very quick) blog post I’ll show you how to add an […]

Read More

How I’m doing my own COVID-19 data analysis using Jupyter, Python, Pandas and Matplotlib

July 21, 2020July 21, 2020 nillsf Leave a comment

Before I start this blog post, let me say this: I’m not a doctor, not a scientist and not a public policy maker. I want to express my support to all of those impacted by COVID-19, and don’t want this blog post to sound soulless. I’m a tech enthusiast, who likes numbers, which is why […]

Read More

About the author

I'm Nills, a cloud architect focused on cloud automation. I share my technical stories on this blog, mainly on Azure, Kubernetes and cloud networking.

Follow @NillsF

Search

Recent Posts

  • Image security scanning in Azure Container Registry
  • Setting up shared image gallery cross-tenant using the Azure CLI
  • Using Pulumi and Python to create a private Azure Kubernetes Service cluster
  • Don’t let 80/20 time become 80/50 time
  • Key Vault CSI driver integrated with AAD-managed pod identities

Categories

  • Azure (52)
  • business (1)
  • certification (1)
  • CKAD series (9)
  • Data Science (6)
  • DevOps (23)
  • Kubernetes (24)
  • Management (21)
  • Networking (10)
  • Open Source (29)
  • Personal Development (8)
  • Security (6)
  • Software Development (9)
  • Uncategorized (26)
  • Windows (10)
  • Wordpress (2)
sparkling Theme by Colorlib Powered by WordPress