When building a machine learning model, it’s important to measure the results of your model. Typically, you split a dataset into a training dataset and a test dataset. The training dataset is used to train your model, while the test dataset is used to measure the performance of your model.
A commonly used method to measure the performance of a classification algorithm is a confusion matrix. A confusion matrix plots the amount of amount of correct predictions against the amount of incorrect predictions. In the case of a binary classifier, this would be the amount of true/false positive/negative. Based on those numbers, you can calculate some values that explain the performance of your model.
In this blog post, we’ll explore the confusion matrix, and calculate the following performance metrics:
- Accuracy
- Recall
- Precision
- Specificity
- F-scores
What is a confusion matrix
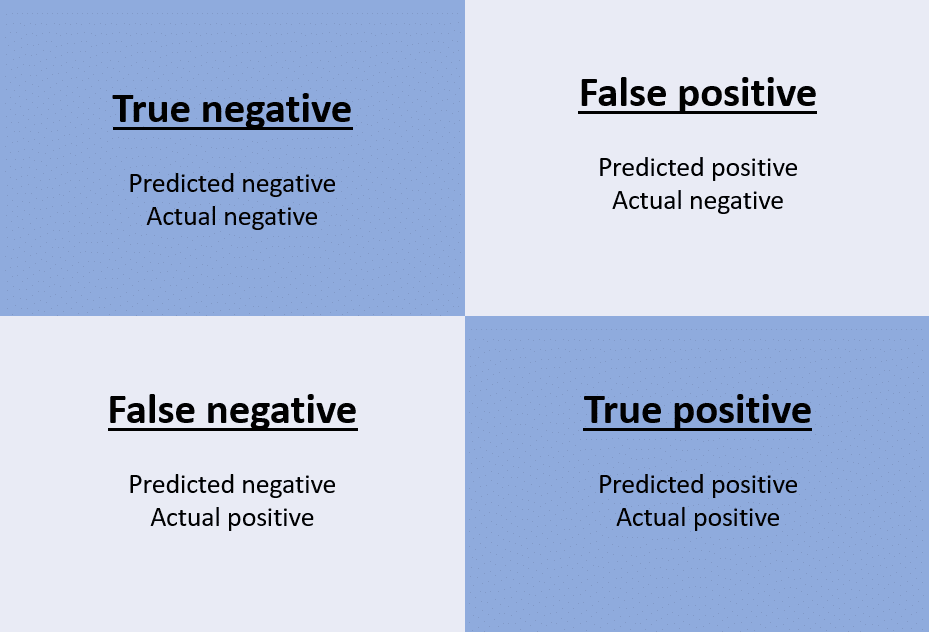
A confusion matrix is a matrix that plots the amount of correct predictions against the amount of incorrect predictions. For a binary classifier, this would mean the amount of true negatives and true positives (correct predictions) versus the amount of false negatives and false positives (incorrect predictions).
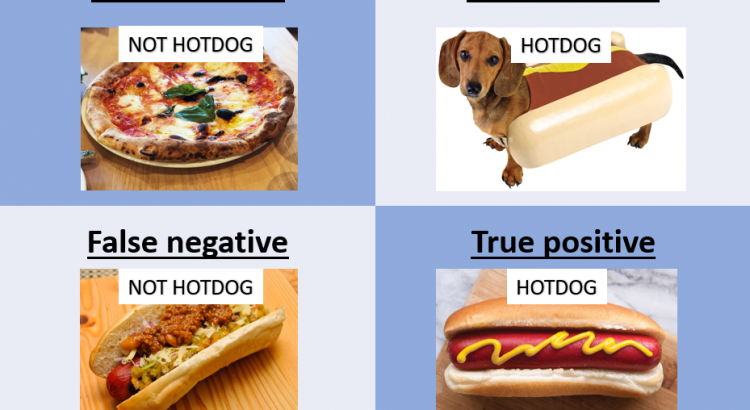
Let’s take an example to make this more concrete: let’s say we were building a model that would predict whether a picture of food contains a hotdog, or not a hotdog. Image four cases:
- A picture of a pizza, correctly labeled as not-hotdog. This is a true negative.
- A picture of a of a dog in a hotdog bun, incorrectly labeled as hotdog. This is a false positive.
- A picture of a hotdog, with sauerkraut and chili, incorrectly labeled as not hotdog. This is a false negative.
- A picture of a hotdog, correctly labeled hotdog. This is a true positive.
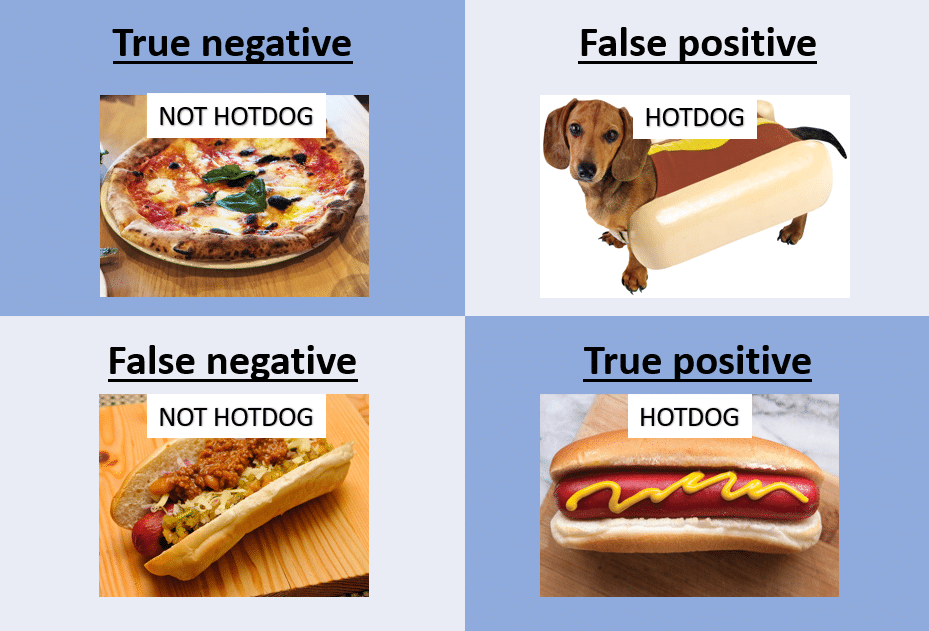
In a confusion matrix, you typically want to see very high values in the diagonal (aka correct predictions), and low values in the other cells. There are a number of ways to express the relationship between the true/false positive/negative, which we’ll explore in the next section.
Metrics derived from the confusion matrix
As mentioned in the introduction, there are a number of metrics on how to measure the performance of a machine learning classifier. We’ll explore those here. For brevity, we’ll no longer spell out true/false positive/negative, but use the following notation:
- TN = true negative
- FP = false positive
- FN = false negative
- TP = true positive
Accuracy
Accuracy is a measure for how many correct predictions your model made for the complete test dataset. It is measured by the following formula:
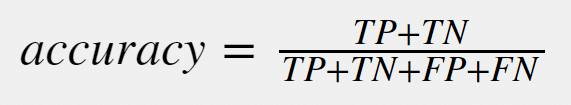
Accuracy is a good basic metric to measure the performance of a model. The downside of simple accuracy, is that accuracy works well in balanced datasets. However, in unbalanced datasets, accuracy becomes a poorer metric.
If we take our hotdog-not-hotdog example, image if we would have 1000 total pictures, out of which 900 would be hotdogs. Even a poorly performing model that would classify each picture as hotdog would have an accuracy of 90%. That’s why we have other metrics for more detailed evaluation.
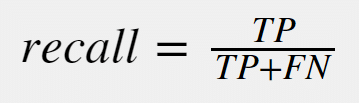
Recall
Recall – or the true positive rate – is the measure for how many true positives get predicted out of all the positives in the dataset. It is sometimes also called the sensitivity. The measure is collected by the following formula:
The recall value can often be tuned by tuning several parameters or hyperparameters of your machine learning model. By tuning those parameters, you could get either a higher recall or a lower recall. A higher/lower recall has a specific meaning for your model:
- High recall: A high recall means that most of the positive cases (TP+FN) will be labeled as positive (TP). This will likely lead to a higher number of FP measurements, and a lower overall accuracy.
A case where you want high recall is in medical models: e.g. in a tumor detection model, you want to model to label everything that could potentially be a tumor to be labelled as a tumor, because a doctor will then interpret these results. - Low recall: A low recall means that you have a high number of FN (should have been positive but labeled negative). This means that you have more certainty that if you found a positive case, this is likely to be a true positive.
Recall is highly related to the next measure, precision:
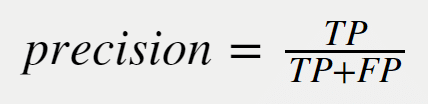
Precision
Precision is a measure for the correctness of a positive prediction. In other words, it means that if a result is predicted as positive, how sure can you be this is actually positive. It is calculated using the following formula:
As with recall, precision can be tuned by tuning the parameters and hyperparameters of your model.
While doing the tuning, you’ll realize that a higher precision typically leads to a lower recall, and consequently a higher recall leads to a lower precision.
In the example we used for recall above (tumor-detection), the high recall means there is a low precision. This low precision isn’t an issue for that use case, since a medical doctor will still evaluate the results. You’d rather have a more false positives (aka lower precision) that miss a positive result that gets incorrectly predicted (aka false negative).
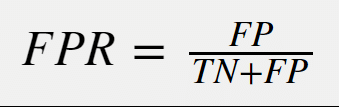
False positive rate
False positive rate is a measure for how many results get predicted as positive out of all the negative cases. In other words, how many negative cases get incorrectly identified as positive. The formula for this measure:
This measure is extremely important in medical testing, together with a related measure namely the false negative rate (calculated similarly to FPR). A false positive namely means that you are tested as being positive, while the actual result should have been negative. The inverse is true for the false negative rate: you get a negative result, while you actually were positive.
F-score
An f-score is a way to measure a model’s accuracy based on recall and precision. There’s a general case F-score, called the F1-score (which is most commonly used), by you could tweak an F-score by setting a value β.
The higher an F-score, the more accurate a model is. The lower an F-score, the less accurate a model is.
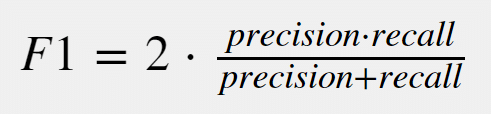
General case: F1
The F1-score is the most commonly used F-score. It is a combination of precision and recall, namely their harmonic mean. You can calculate F1-score via the following formula:
The higher the F1 score, the more accurate your model is in doing predictions.
Special cases: F-score with factor β
The F1-score is a generalized case of the overall F-score. The overall F-score has a factor β, which defines how much influence precision/recall has over the evaluation:
- β < 1: Precision oriented evaluation
- β > 1: Recall oriented evaluation
The formula for the general case of F-scores is:
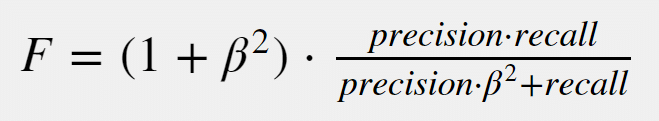
You can deduce from this formula that the F1 score is a generalized case where β is 1, meaning precision and recall are balanced.
How to get these metrics in scikitlearn
Finally, let’s look into how we can get these metrics in scikitlearn. Scikitlearn has a metrics module, that contains formulas for all these metrics. For all formulas available, please refer to the documentation. In what follows, you’ll see a short code block that shows 4 of the metrics we discussed in this blog post (scikitlearn doesn’t have a FPR score method):
from sklearn.metrics import accuracy_score, precision_score, recall_score, f1_score, fbeta_score

# Accuracy
accuracy_score(y_test, y_predicted)
# Precision
precision_score(y_test, y_predicted)
# Recall
recall_score(y_test, y_predicted)
# F1-score
f1_score(y_test, y_predicted)
# F-beta-score
fbeta_score(y_test, y_predicted,beta=10)
Summary
In this post we had a look at the confusion matrix, a common tool used to evaluate classification models. We also looked into 5 commonly used metrics to evaluate the performance of those models. We finished by having a quick look into how we can use these scores in scikitlearn.
One thought to “Confusion matrix, accuracy, recall, precision, false positive rate and F-scores explained”