Azure Storage can provide you detailed log information about all transactions happening against your storage account. There are default metrics that are gathered and shown through Azure Monitor. Additionally, you can configure logging on the storage account that give you a log information on a per request basis.
Analyzing these logs can be a bit difficult and painful. These logs are spread out in multiple files, and are simple comma separated files. In this blog post I’ll explain how you can analyse these logs using Python and Pandas. I’m very new to this, so my solution might not be the best.
Let’s have a look!
Setting up storage logs
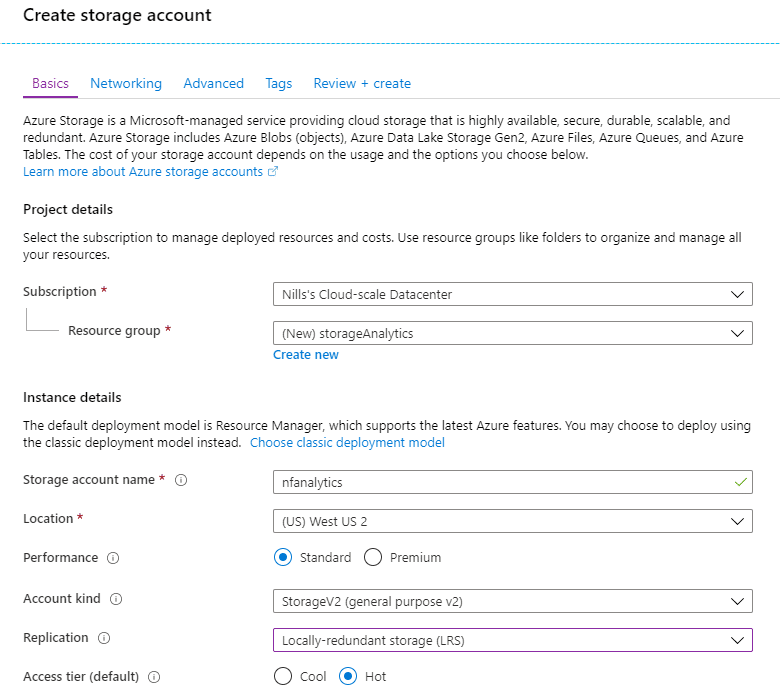
For the purpose of this demo, I’ll create a new storage account.
Next up, we’ll go into the classis diagnostics settings. Then we’ll enable our storage logging.
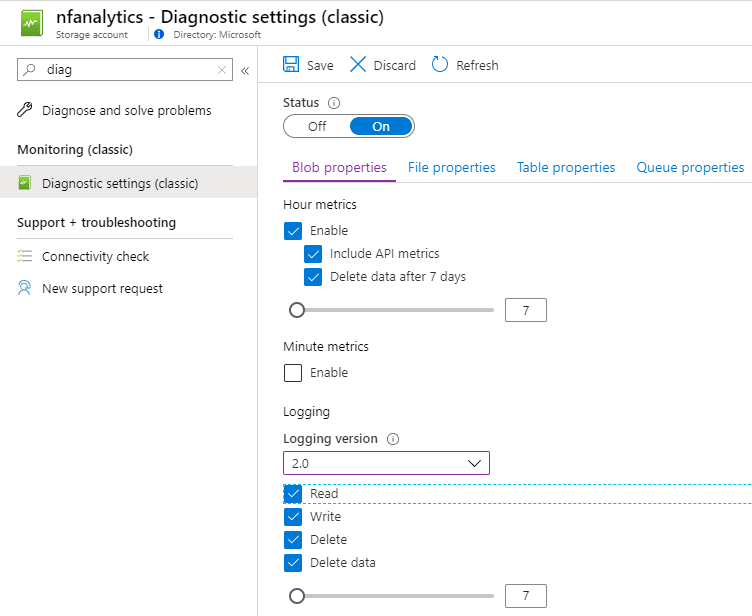
This will create a new storage container called $logs that will contain all the logs. These logs contain a wealth of info, like:
- Time
- API call
- HTTP status code
- Request IP
- User-Agent-header
- …
If you’re doing some troubleshooting on storage, these logs might be very useful for you.
At this point, you’ll want to start creating some data. I used the Azure Storage Explorer to upload some sample data, that would generate some sample logs for me to use.
Consuming storage logs in Azure Notebooks
If you’ve never dealt with an Azure Notebook, let me take a minute to explain what they are. Azure Notebooks is a free hosted service to develop and run Jupyter notebooks in the cloud with no installation. It allows you so quickly run Python or R based notebooks without having to provision any infrastructure.
I personally have played around with a couple of notebooks as part of my learning for DP-100, but I never started from scratch, which is what I did for this one.
As a goal for my log analysis here, I wanted to get a count per minute of each ‘User-Agent-header’ connecting to my Azure storage account. Let me walk you through this:
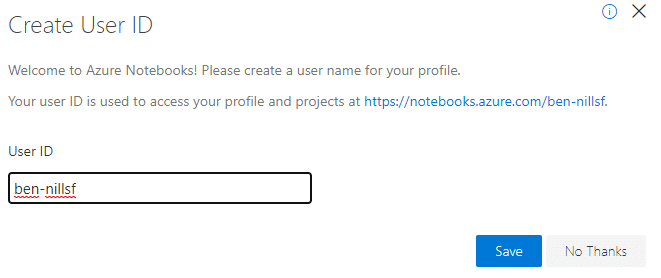
Start by going to Azure Notebooks and signing in. If this is your first time signing in, you’ll need to provide a name for your profile.
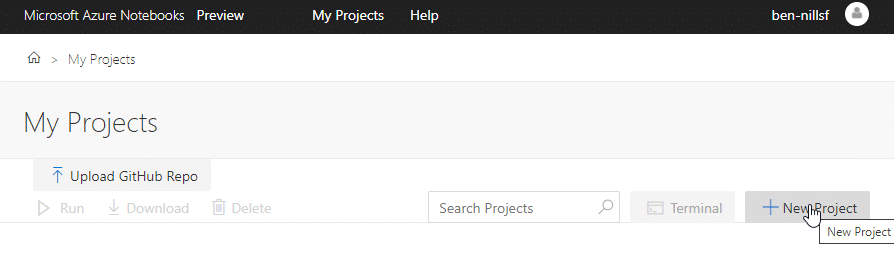
Once that is created, head on over to ‘My Projects’ and create a new project.
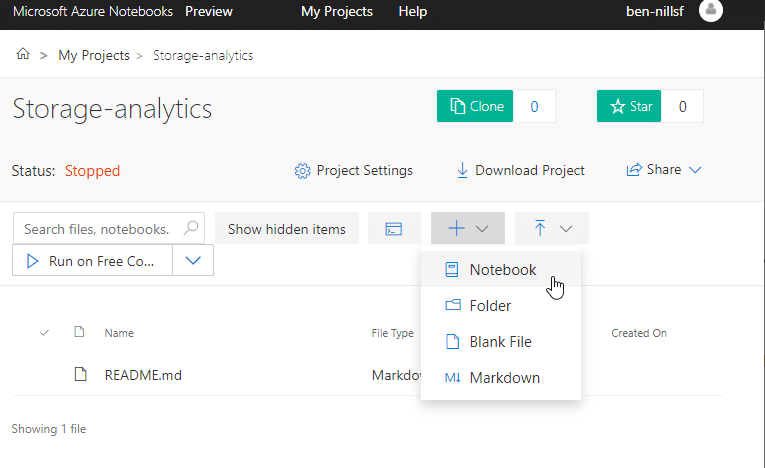
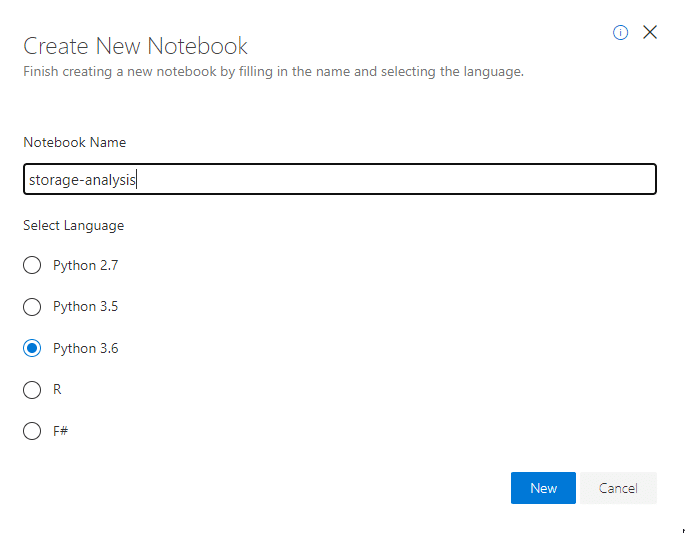
Once you have the project open, you’ll also want to create a Notebook. In our case, we’ll create a Python 3.6 notebook.
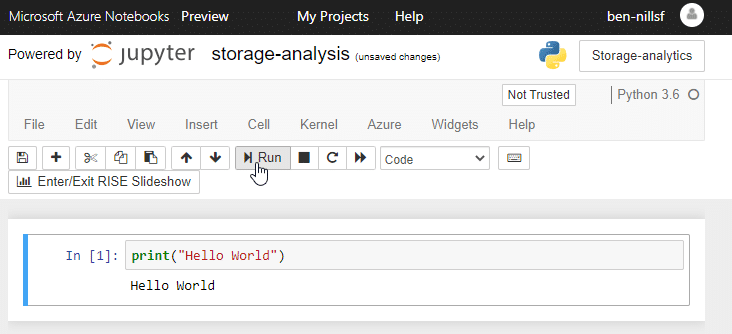
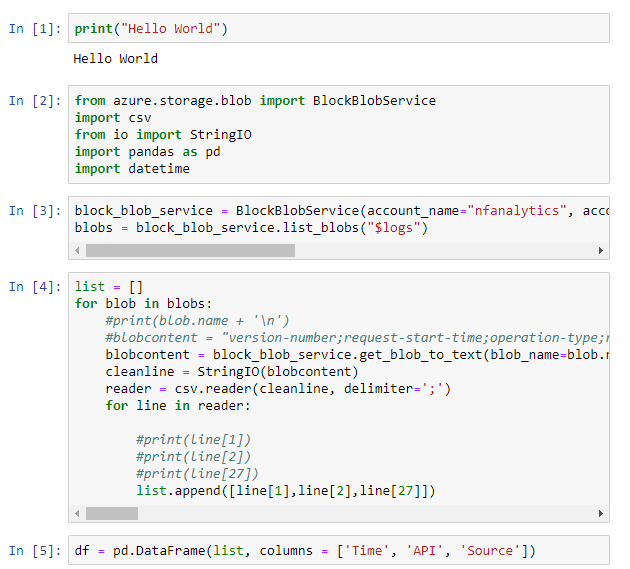
Click on the workbook name, and you’ll be taken into your Notebook. A Notebook can have multiple cells that share memory state, but can be executed independently. If you’ve never touched a notebook before, why don’t you type print('Hello World') to actually do your first Hello World! Hit either the graphical run button or CTRL+Enter to run the cell.
Now comes the fun part, the actual code. Going through the code is hard to explain, but let me provide you with the essential code and steps that I wrote to get this working:
from azure.storage.blob import BlockBlobService
import csv
from io import StringIO
import pandas as pd
import datetime
The snippet of code above is just to import the necessary libraries into our working set.
block_blob_service = BlockBlobService(account_name="nfanalytics", account_key="xxx")
blobs = block_blob_service.list_blobs("$logs")
The snippet above is to list all blobs in the $logs container.
list = []
for blob in blobs:
    #print(blob.name + '\n')

    blobcontent = block_blob_service.get_blob_to_text(blob_name=blob.name,container_name="$logs").content
    cleanline = StringIO(blobcontent)
    reader = csv.reader(cleanline, delimiter=';')
    for line in reader:

        #print(line[1]) #date
        #print(line[2]) #API
        #print(line[27]) #user-agent
        list.append([line[1],line[2],line[27]])
The snippet above actually opens each log file, and stores the data I am interested in (date, API and user-agent) in an Array.
df = pd.DataFrame(list, columns = ['Time', 'API', 'Source']) And the following snippet imports this into Pandas. Pandas is a Python library that makes it easier to work with collections of data and do aggregations, summaries and much more.
Let’s take a brief pause here and execute all our cells, and think about what we’ve done and what we still need to do.
Thus far we have:
- downloaded our logs from blob
- loaded them into an array
- transformed that array into a Pandas Dataframe.
What we now need to do is find a way to transform this data to represent a graph that shows us per minute which user-agent is being used most often. Let’s explore.
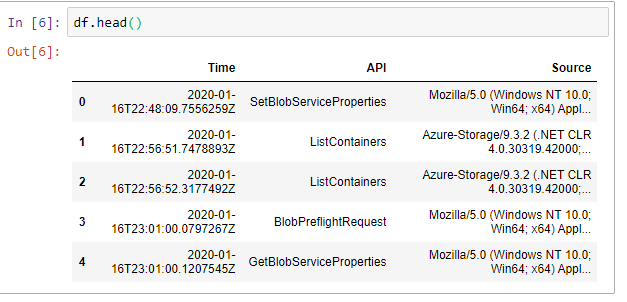
Let’s start our exploration by having a look at our dataframe. This can be done via df.head().
Now, we’ll do a couple steps to clean up the Time info here. We’ll first convert into an actual datetime object and then use that as an index for our timeseries:
df['Time'] =  pd.to_datetime(df['Time'])
dfi = df.set_index('Time')
Now comes a bit of a weird step. We’ll use the get_dummies function to transform our column with the Sources into a column and a counter. This will come in handy once we aggregate our data per minute and want to sum our occurrences (which we’ll also do). If you want to understand what is going on with this step, you can peak at the data again using the head() function.
dfidum = pd.get_dummies(dfi, columns=['Source'])
dfimin = dfidum.resample('60s').sum()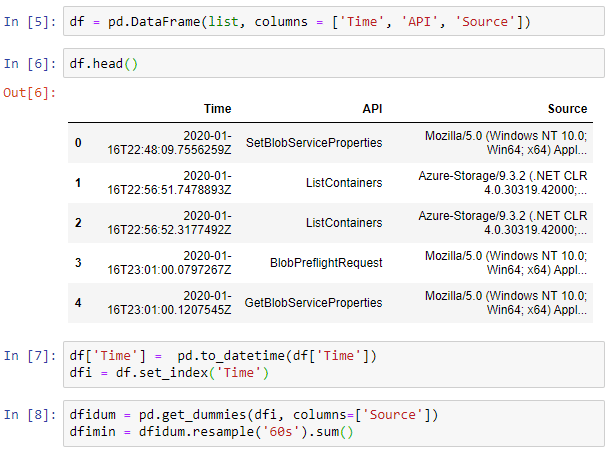
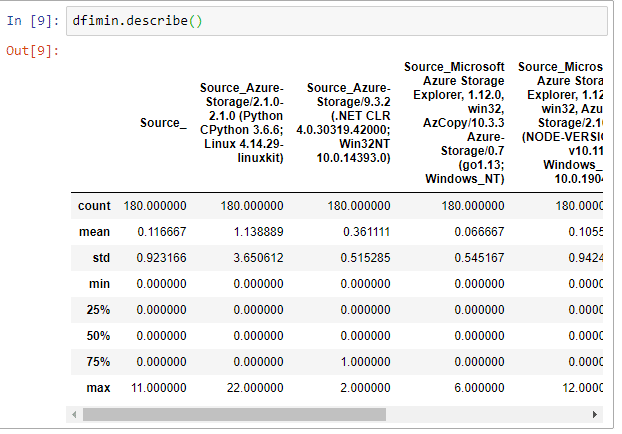
And now we can do our actual analysis. There’s a couple things we can do now. An interesting numerical analysis is using the describe() function, like this. dfimin.describe(). This describe does a numerical analysis on all columns.
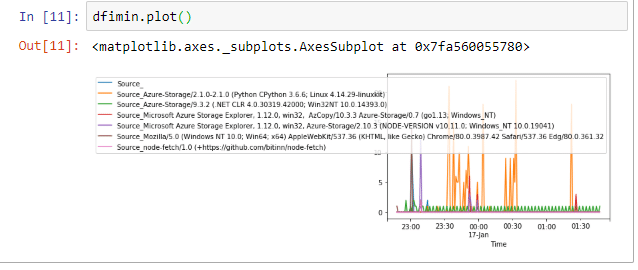
We can also create a plot, that shows the time series in a nice graph. This can be done via dfimin.plot().

Conclusion
In this blog post we looked into how we can do some rudimentary analysis of Azure storage logs using a Jupyter notebook. We were able to analyse the most popular user-agent strings when connecting to Azure storage. Which in my case is the Python SDK funnily enough.
This is very basic analysis. I’m not a data analyst, but this analysis took me about 2 hours to build, so not too bad I would say. And best of all, it was all free!